Optimization of Daylit Space
Background
Due to the growth of energy consumption, the tendency of global warming has been sped up. Building energy consumption occupied more than 20% of the energy consumption and lighting energy consumption has an about 15% of building energy consumption. In addition, some research had proven sunlight that has a positive impact on children and work efficiency. Therefore, it is important to obtain clean energy to supply the building lighting. However, excessive daylight also leads the glare for occupants. We tried to use a multi-objective genetic algorithm to balance between reducing glare and improving subjective satisfaction.
Method
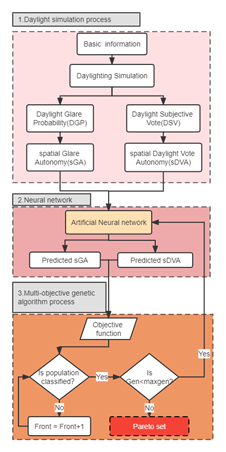
The proposal process of this work contains three sections, which include daylight simulation, training of the artificial neural network, and comparison of shading devices.

Figure 1. The process used to optimize a shading device based on MOGA.
Daylight simulation
First, daylight simulation is conducted to obtain the value of the objective function, which serves as the basis for optimization. The Ladybug and Honeybee platforms from the Grasshopper plugin in Rhino were used for the simulation. The daylight simulation engine was based on Radiance software.
Objective function
To minimize glare and maximize occupants’ visual satisfaction in a dynamic daylight environment, the objective function includes sGA and sDVA.
Artificial Neural network (ANN)
Artificial intelligence was an effective and feasible tool to generate the prediction model. Many researchers had applied the Artificial Neural network (ANN) in the field of daylighting simulation over the last few years and achieved good performance.
Multi-objective genetic algorithm (MOGA)
This study addressed a multi-objective problem with two objectives that change in opposite directions, so its solution was not unique. A solution that is not dominated by another is called a nondominated solution, and the group of nondominated solutions generated in the optimized algorithm is called a Pareto set, which can be obtained by the MOGA.
Case Study
Our method for optimizing and selecting a shading strategy was applied to a university library in Shanghai, China (W121.433°, N31.028°). We chose the west side of the top (fourth) floor of the studied region because it was exposed to very strong sunlight in the afternoon due to the very high glazing ratio (42.6%) in the western façade. The floor plan of the test region is provided in Figure 2, along with photos of existing conditions.

Figure 2. The studied library, plan of the studied area, virtual test points of DSV, DGP , and photos showing actual conditions.
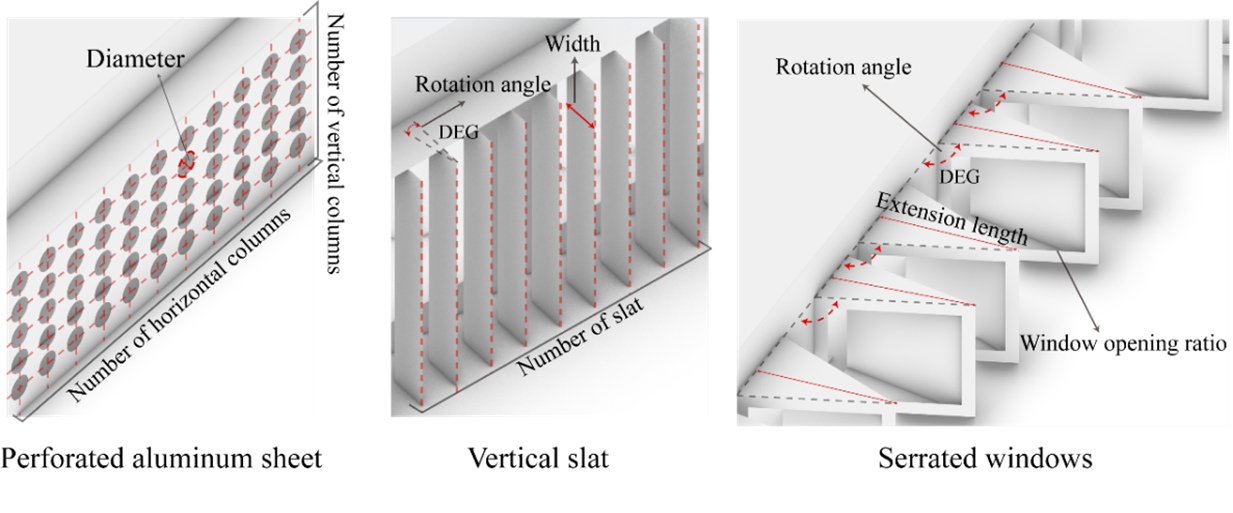
To remedy the poor existing window design, four shading strategies, namely, perforated aluminum sheet (PAS), vertical slats (Vs), serrated windows with southern orientation (Sw_S), and serrated windows with northern orientation (Sw_N), were selected for optimization and comparison. Figure 3 shows the four strategies and the corresponding design variables. Perforated aluminum sheet changes the window-to-wall ratio to prevent glare and at the same time changes the distribution of daylight. The number and size of the holes in the PAS are the key parameters of shading effectiveness. As a result, the design variables of the PAS are the number of holes in the vertical and horizontal columns and also the hole diameters.
Shading strategies
To remedy the poor existing window design, four shading strategies, namely, perforated aluminum sheet (PAS), vertical slats (Vs), serrated windows with southern orientation (Sw_S), and serrated windows with northern orientation (Sw_N), were selected for optimization and comparison. Figure 3 shows the four strategies and the corresponding design variables. Perforated aluminum sheet changes the window-to-wall ratio to prevent glare and at the same time changes the distribution of daylight. The number and size of the holes in the PAS are the key parameters of shading effectiveness. As a result, the design variables of the PAS are the number of holes in the vertical and horizontal columns and also the hole diameters.
When vertical slats are used, the angle of the slats can be adjusted to obstruct most daylight from directly entering the room. Lee et al. considered Vs to be the best shading device among vertical louvers, horizontal louvers, eggcrate louvers, overhangs, vertical slats, horizontal slats, and light shelves for improving UDI at the east and west orientations. The design variables of Vs are the number, width, and rotation angle of the slats.
Serrated windows transform the received sunlight from direct to diffuse by alternating the orientation of the windows. In this study, the Sw “changes” the façade orientation from west to south, to avoid the direct afternoon sunlight from the west while taking advantage of the diffuse sunlight from the south or north. To more accurately research the shading strategy, we separately set the opening surface in the opposite direction, namely, one was the serrated windows facing south (Sw_S) and the other one is the serrated windows facing north (Sw_N). The design parameters of the Sw are the rotation angle, extension length, and window opening ratio of the blocking surface.

Figure 3. Four studied shading strategies and corresponding design parameters, where the serrated windows represent the different shading strategies of Sw_S and Sw_N.
Result
This section first presents the formula that was developed for the prediction of subjective satisfaction with the daylight environment using the horizontal illuminance level. Next, the result of training an artificial neural network (ANN) and the daylight performance of the original environment are shown. Finally, the optimization of the four shading strategies is described, and the strategies are compared.
Daylight subject vote (DSV) formula
A formula was developed from the surveyed data to correlate the daylight subjective vote (DSV) with the horizontal illuminance level. According to ISO 8995 [52], the data was first “binned” into (150,200], (200,300], (300,500], (500,750], (750,1000], (1000,1500], (1500,2000], (2000,3000], (3000,5000], (5000,10000], (10000,15000], (15000,20000], (20000,25000] and (25000, -] intervals of illuminance. Next, the mean DSV value for each bin was calculated; these values are presented in Figure 4. Because the illuminance level increased much faster than the change in the occupants’ DSV, the x-axis was transformed logarithmically, as is commonly practiced in daylighting research.

Figure 4. Relationship between DSV and horizontal log illuminance.
Artificial Neural network (ANN) results
An artificial neural network enables fast acquisition of dynamic daylight performance with the shading device. It can be seen that R², root mean square error (RMSE), and mean absolute error (MAE) between test data and predicted data have a good fit, as shown in Figure 5.

Figure 5. The fitting accuracy of artificial neural network for the daylight environment with PAS, Vs Sw_N and Sw_S.
Original daylight environment
In this section, the performance of the original daylight environment was simulated and displayed by the hourly spatial average of daylight subjective vote (DSV) and daylight glare probability (DGP) throughout the entire year. Figure 6(a) shows the hourly DSV for an entire year for the original daylight environment without any shading devices. From a year-round perspective, DSV was lower in the period 8:00 a.m. to 2:00 p.m. of spring (March to May) and summer (June to August), and relatively higher in the period (3:00 p.m. to 6:00 p.m.). The DSV performance was determined by the illuminance levels, and natural illuminance levels are related to solar intensity. It can be deduced that the intensity of sunlight from 8:00 a.m. to 2:00 p.m. was appropriate and did not shine directly into the interior space. In autumn (September to November) and winter (December to February), the satisfaction levels were higher than those in spring and summer.

Figure 6. The distribution of DSV and DGP for the original daylight environment: (a) the DSV from 1/1 to 12/31 for a daylit time in the daylight environment, (b) the DGP from 1/1 to 12/31 for a daylit time in the daylight environment, (c) the ratio for each satisfaction level, and (d) the ratio for each glare level.
The distribution of hourly DGP for an entire year in the original daylight environment was present in Figure 6(b). It is obvious that the perceptible, disturbing and intolerable glare levels in the west-facing spaces were distributed between 12:00 and 6:00 p.m., while most of the imperceptible glare was during the morning hours.
Figure 6(c) shows the distribution of different satisfaction levels of DSV in the original daylight environment. The ratio of unsatisfactory and very unsatisfactory levels was nearly 20%. It was confirmed that the presence of too high and too low illuminance levels in the original daylight environment caused high DSV value and dissatisfaction. Figure 6(d) illustrates the DGP distribution for each glare level in the original daylight environment. The perceptible disturbing, and intolerable glare accounted for more than 20%. The percentage of intolerable glare accounted for more than half of the glare with DGP > 0.35.
Optimization of shading strategies (Excerpt)
The optimization results for the four strategies, including perforated aluminum sheet (PAS), vertical slats (Vs), serrated windows facing south (Sw_S), and serrated windows facing north (Sw_N), are discussed in this section, where the MOGA optimization, the final Pareto set, and the daylight environment of the near-optimal shading device for each strategy are presented and compared.
Vertical slat Figure 7 shows the Pareto set of the Vs, which had 429 solutions after optimization. All solutions of the Pareto set had a better sGA than the daylight environment without a shading device. Thus, the Vs effectively reduced the glare. Although these nondominated solutions reduced the glare, only 68 of the solutions displayed in red had better sDVA performance than the original environment. Considering the practical needs of occupants, a near-optimal solution is shown in yellow, with similar sDVA to the original environment, while maximally reducing the glare.

Figure 7. The Pareto set of Vs, the solution of the original performance, solutions with better performance than the original one, the solution of best sGA and best sDVA, and the near-optimal solution in the Pareto set.
Figure 8(a) displays the distribution of hourly DGP for an entire year for the near-optimal Vs. We can see that most of the perceptible glare was occupied in the afternoon (1:00 p.m. to 5:00 p.m.) of autumn and winter months This implies that the slats of the near-optimal Vs efficiently reduced the glare from the low solar angle during the autumn and winter months. Figure 8(b) shows the distribution of different glare levels of DGP in the daylight environment with the near-optimal Vs. The ratio of disturbing and intolerable glare levels was lower than 8%. The near-optimal Vs blocked most of the glare and improved visual comfort, as compared with the original environment.

Figure 8. The distribution of DGP for the near-optimal Vs: (a) from 1/1 to 12/31 for a daylit time in the daylight environment, and (b) the ratio for each glare level.
Comparison of the four shading strategies
Figure 15 compares the Pareto sets for the four shading strategies, namely, the perforated aluminum sheet (PAS), vertical slats (Vs), serrated windows facing north (Sw_N), and serrated windows facing south (Sw_S). As displayed in Figure 15, Sw_S and PAS had a relatively bad performance for both spatial glare autonomy (sGA) and spatial daylight vote autonomy (sDVA). The Pareto sets for the PAS and Sw_S coincided with each other for complementary sGA0.35/95% values between 0.25 and 0.33, indicating that the two strategies had similar performance in that range. Furthermore, Sw oriented to the north performed better than that oriented to the south. The university library has turned about 20 degrees to the east, which resulted in much more sunlight exposure from the south.

Figure 9. Comparison of the Pareto sets for Sw_N, Sw_S, Vs, and PAS.
Discussion
The principle of the shading strategy
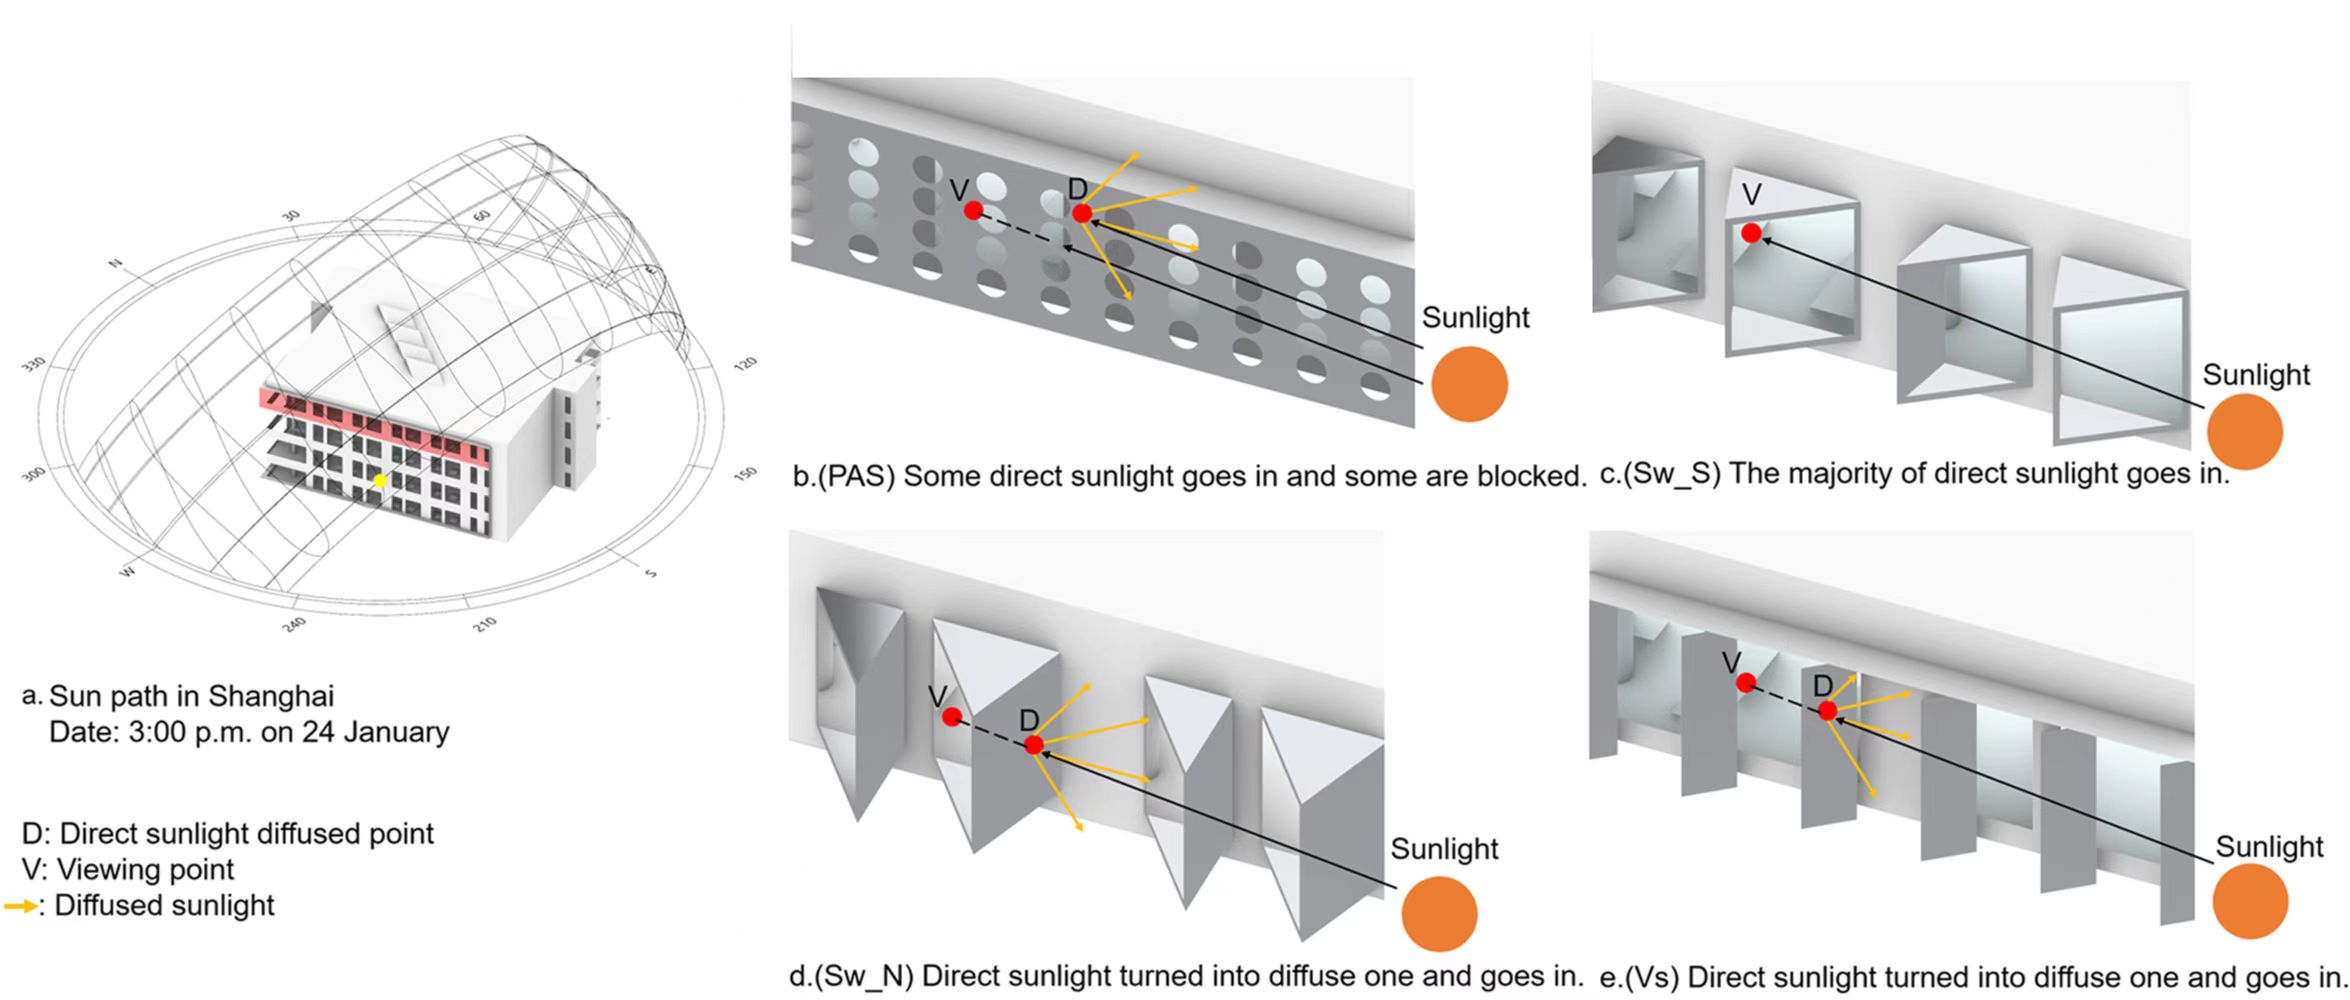
The shading strategy reduces the glare and maintains a satisfactory level in the daylit space by blocking direct sunlight or diffusing direct sunlight into indoors. Therefore, the design of the shading surface is very important for each shading strategy. In this study, we compared four shading strategies, where the shading design and the result of the comparison as shown in Figures 3 and 15, respectively. We then found a dramatic difference in daylight performance between the four shading strategies, especially Vs and Sw_N had a better daylight performance than PAS and Sw_S. The performance gap for each shading strategy could be explained by the shading design of blocking and diffusing direct sunlight. We choose the 3:00 p.m. on 24 January to conduct the analysis of shading principles for four strategies, and the sun path in the time is shown in Figure 17 (a). Figure 17 (b) shows PAS blocks a part of direct sunlight by the unperforated surface, but it lacks the characterizer of diffusing direct sunlight and the glare may be happened by the sunlight through the hole. Sw_S almost couldn’t block the sunlight from the south to the west, and it worked until the sun fully move to the west which was nearly sunset, the diagram as shown in Figure 17 (c). On the contrary, Figure 17 (d) displays Sw_N could block the direct sunlight from the south to the west by the south shading surface, and the shading surface also could diffuse some sunlight into the abut window to maintain the reasonable illuminance level. As shown in Figure 17 (e), the diagram of shading principles for Vs, where the slat of Vs reflects the direct sunlight to the abut slat or indoor space to reduce glare.

Figure 10. The sun path in Shanghai at 3:00 p.m. on 24 January (a), the shading diagram of (b) PAS, (c) Sw_S, (d) Sw_N, and (e) Vs, respectively.
Limitations
Our case study shows the multi-objective genetic algorithm can provide continuous and comprehensive performance curves, and thus was very effective for comparing different shading strategies. However, limitations exist. Shading design not only impacts visual comfort but also has significant effects on thermal comfort, the occupants’ view, and building energy consumption. In addition to blocking light, shading prevents solar heat from entering the building and impedes the occupants’ views to outside environment. Although this study was focused only on the daylight environment, the design method proposed can also be applied to the optimization of the shading strategy in terms of solar-related thermal comfort, building energy consumption, and occupants’ view. Our study proposed a formula to correlate illuminance with subjective daylight satisfaction based on the analysis of field survey data. However, this formula may not be accurate under low illuminance levels, since the data was collected during normal working hours on sunny days when the illuminance was above 150 lux.
Conclusion
Many shading strategies are available to control unwanted glare, but in doing so they may overly reduce illuminance. This study proposed a method to optimize and compare the performance of different shading strategies by a multi-objective genetic algorithm (MOGA). An artificial neural network was combined into the optimization to efficiently reduce the simulation time. Meanwhile, based on data collected from a field survey, a formula was developed to calculate subjective satisfaction (daylight subjective vote, DSV) from the illuminance level. Considering the temporal and spatial performance of the daylight environment, we set the objective function by using the spatial glare autonomy (sGA) and spatial daylight vote autonomy (sDVA) based on DGP and DSV, separately. The proposed method was then used in a case study in a university library in Shanghai, China, to optimize and compare the performance of four shading strategies, namely, perforated aluminum sheet (PAS), vertical slats (Vs), serrated windows facing north (Sw_N), and serrated windows facing south (Sw_S). The following conclusions and contributions were made in this study:
1) The developed DSV formula described a quadratic relationship between horizontal illuminance level and subjective satisfaction with the daylight environment. The highest satisfaction was found to occur at approximately 1000 lux, and the satisfaction level declined with an increase or decrease in illuminance.
2) Under the climate of Shanghai, PAS and Sw_S had relatively bad performance among the four strategies; Serrated windows with northern have a better performance than serrated windows with southern.
3) A good shading device should be able to turn direct sunlight into diffusive one. Compared with the original design without shading strategies, the near-optimal designs for PAS, Vs, Sw_N, and Sw_S greatly reduced the complementary sGA0.35/95%, by 9%, 22%, 8%, and 8%, respectively, while maintaining a similar level of satisfaction with the daylight environment.
